Java Matrix Benchmark
Late last year (December 2021) new results were published over at the Java Matrix Benchmark web site. ojAlgo performed well, as always, but this time there seemed to be some performance regression with ojAlgo. That benchmark used ojAlgo v49.0.1. Indeed there was a problem introduced with v49.0.0. That was fixed in v50.0.2.
It’s been years since I ran that benchmark myself, and I wanted to verify the results with the regression fixed; so I ran the benchmark.
Tested Libraries
| Library | Version |
|---|---|
| Colt | 1.2.0 |
| Commons Math (ACM) | 3.6.1 |
| EJML | 0.41 |
| JAMA | 1.0.3 |
| la4j | 0.6.0 |
| MTJ | 1.0.8 |
| ojAlgo | 50.0.2 |
| Parallel Colt | 0.9.4 |
Compared to the default set of benchmarked libraries, 2 have been excluded:
- jblas – primarily interested in comparing pure Java libraries, and this is the only library using native code still included. Both MTJ-N and UJMP-N are already excluded, from the default set, because they stopped working (neither has been maintained for years). I believe there is also ongoing work to add ND4J to the benchmark, but as far as I know it’s not included because of some problem getting it to work.
- UJMP – it’s a meta library with dependencies on “all” other libraries. In many cases when it shows good performance it is actually another library that is responsible for that.
Running the benchmark takes (more than) 1 day per library. That’s why there’s an interest to remove libraries.
Hardware & JVM
- Hardware: Google Cloud Platform Compute Engine c2-standard-4 (4 vCPU:s, 16 GB memory) with Intel Cascade Lake processors.
- OS: Debian GNU/Linux 10 (buster)
- JDK: Java HotSpot(TM) 64-Bit Server VM, 17.0.1+12-LTS-39 from Oracle.
- The benchmark heap size was 8GB (half of the 16GB available).
Results
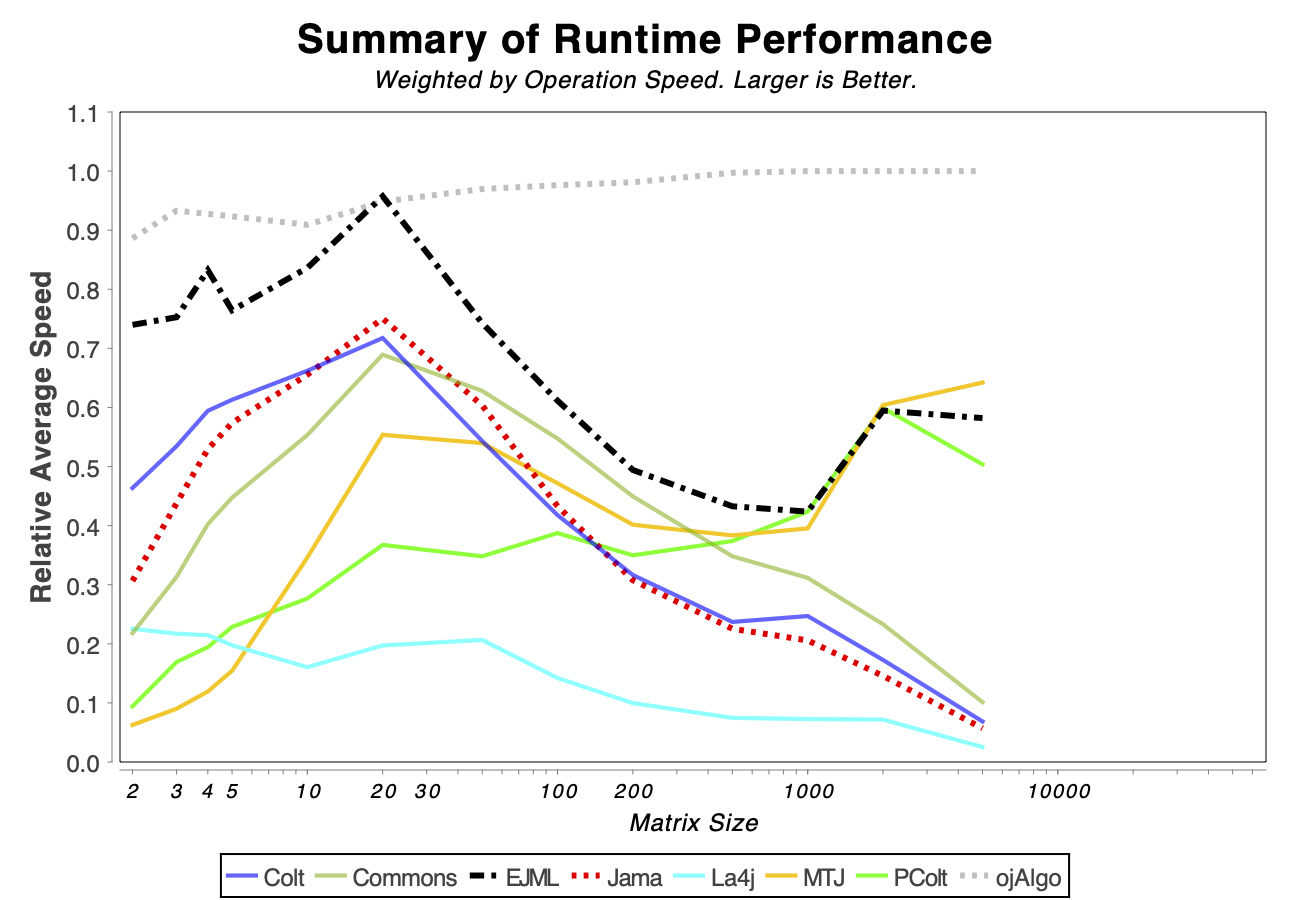
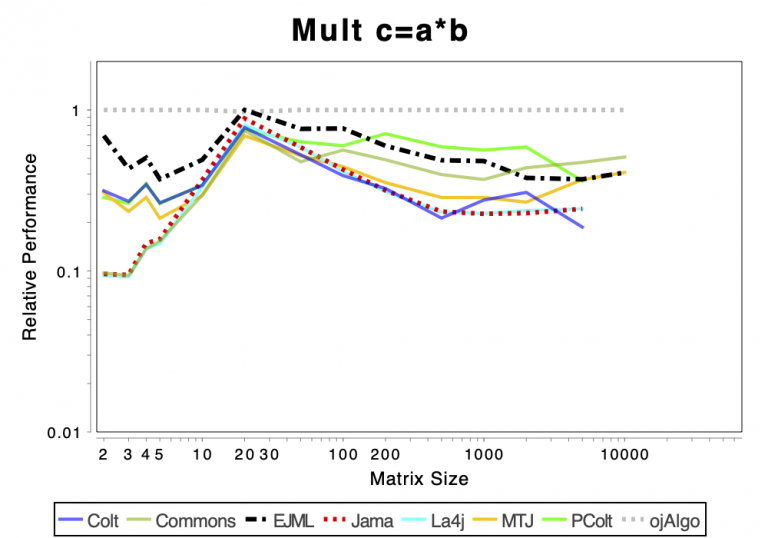
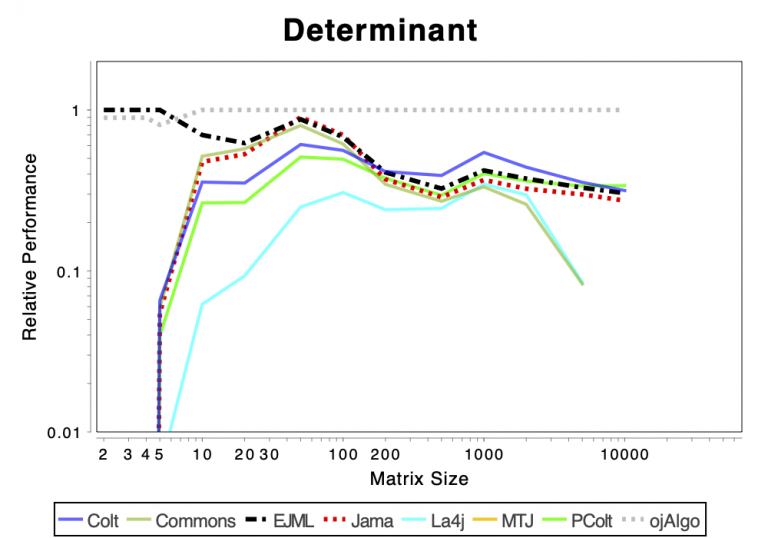
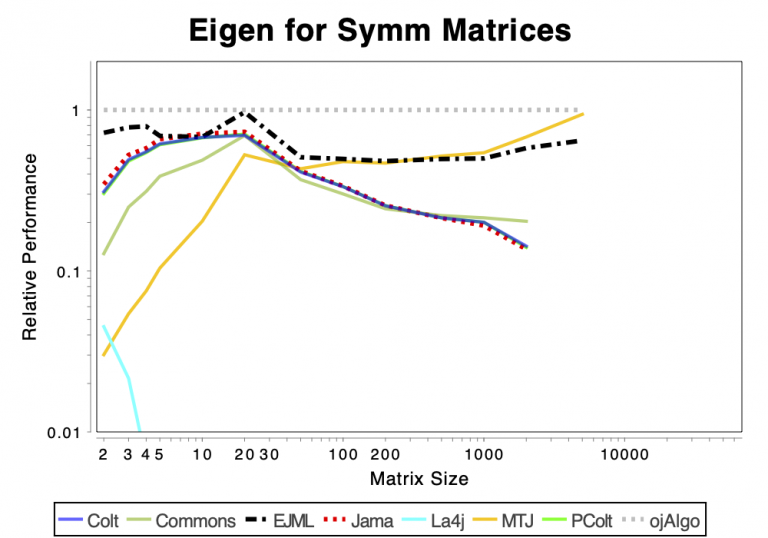
The charts shows relative performance. The fastest library, for each operation at each matrix size, has relative performance 1.0. A library that performs a specific operation for a specific matrix size, half as fast has the fastest library has relative performance 0.5…
The chart above attempts to show 1 combined performance measure – the results of the individual tests are aggregated using weights corresponding to the complexity of the operation. Don’t know exactly how this is done – didn’t write the benchmark – but I recommend looking at the charts for each of the individual operations instead (below).
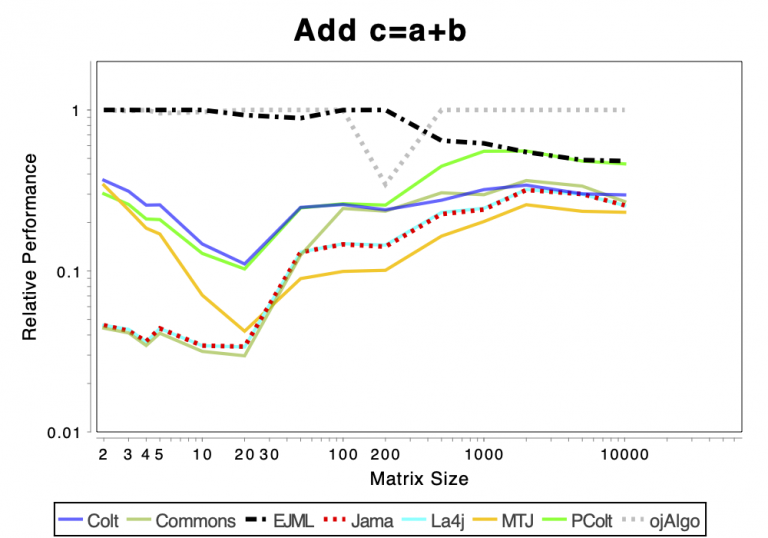
If the curve for a specific library is not drawn at all it means that function is not supported or has a problem. If only the last points (representing the largest matrices) are missing the implementation is too slow and/or consumes too much memory. Don’t just look at which library is the fastest. Also look at which libraries fail to complete the operations for the larger cases (that other libraries handle). That’s a very good indication of excessive resource requirements.
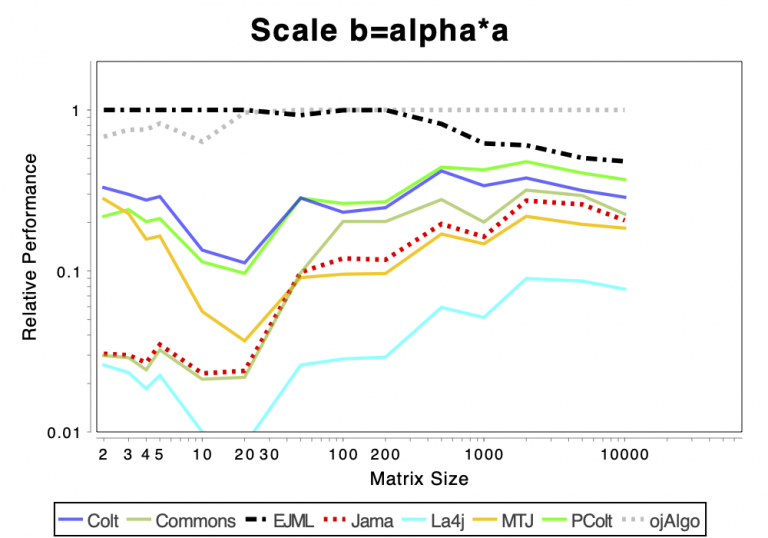
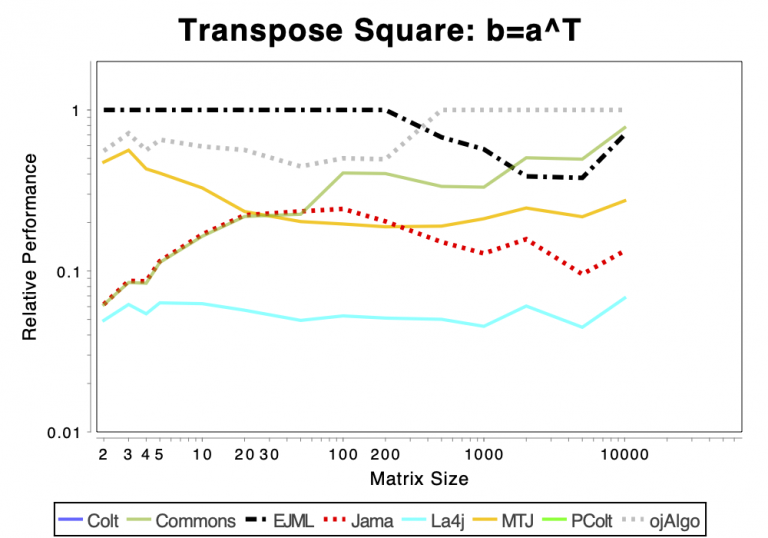
The Very Basics
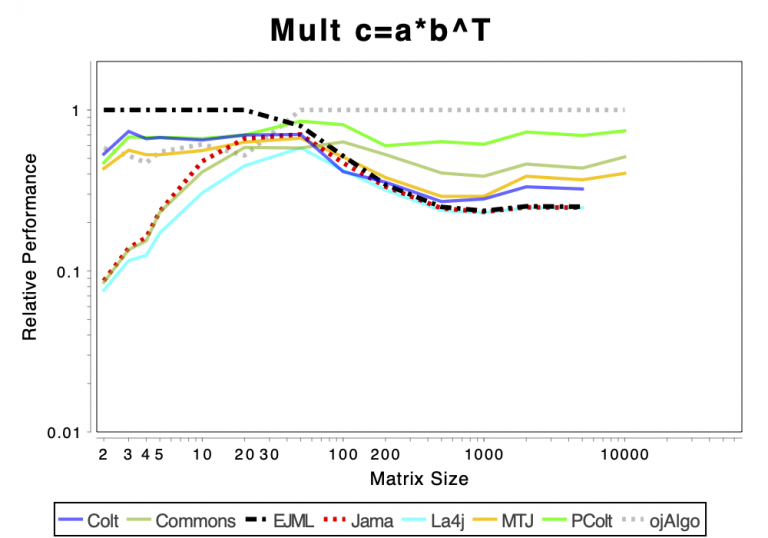
More Advanced Operations
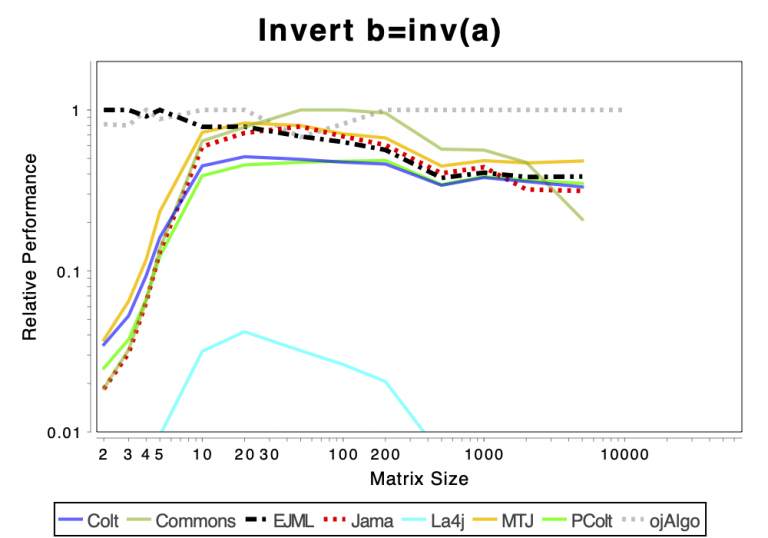
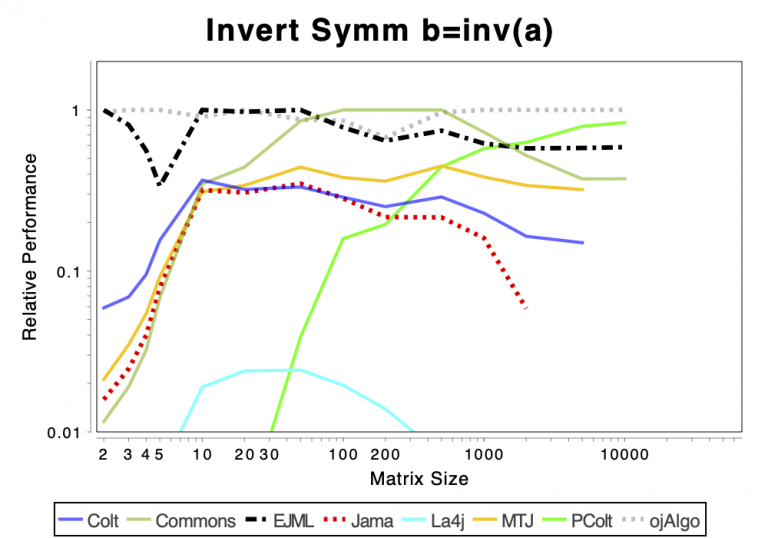
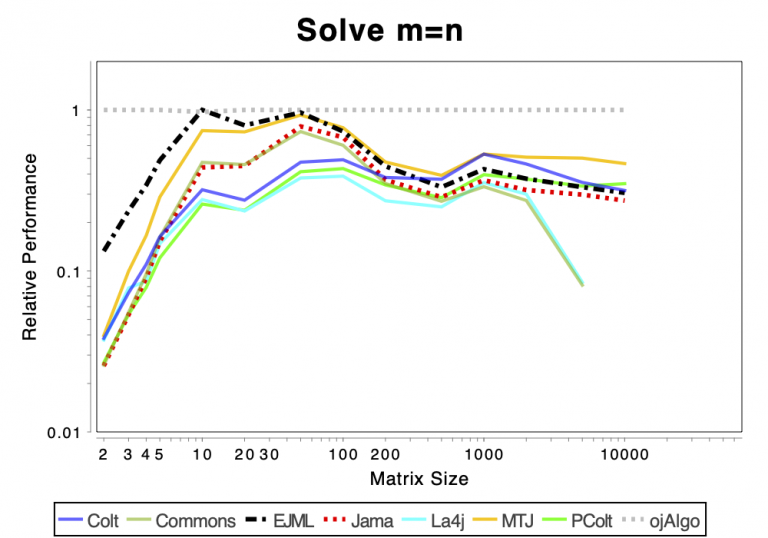
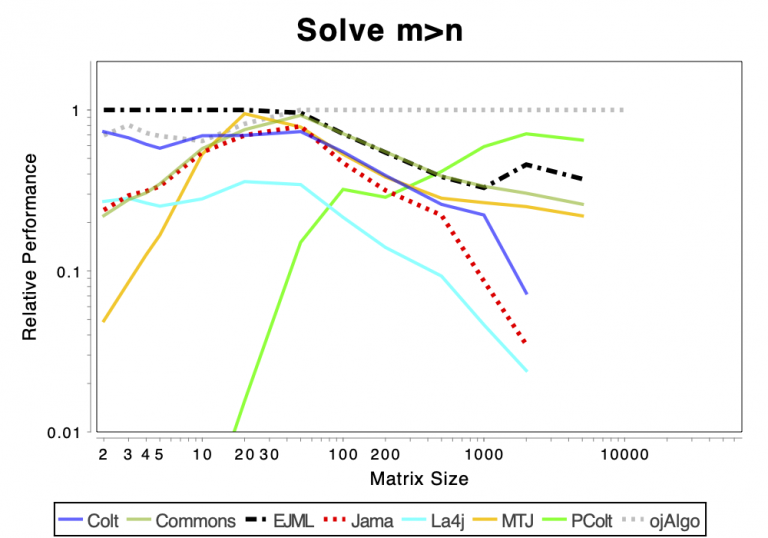
Solving Linear Systems
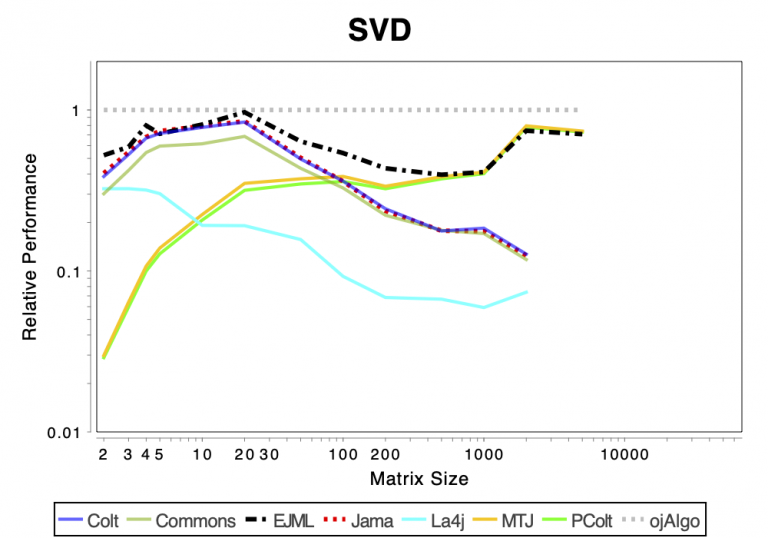
SVD & EvD
- ← Previous
v51 with the return of ojAlgo-finance - Next →
MIP Strategy Configuration